Time & Attendance
Keep track of employee work hours and attendance with precision and ease.
Explore
With the Gantt Chart, tracking task progress and dependencies is easy, ensuring all team members know their responsibilities and deadlines.

It enables managers to visualize availability to optimize resource use, help allocate tasks effectively, and prevent overburdening team members.

It helps define roles and responsibilities within the project timeline to ensure team members are accountable for their tasks.
Give employees access to real-time data to ensure seamless communication throughout the project's execution.
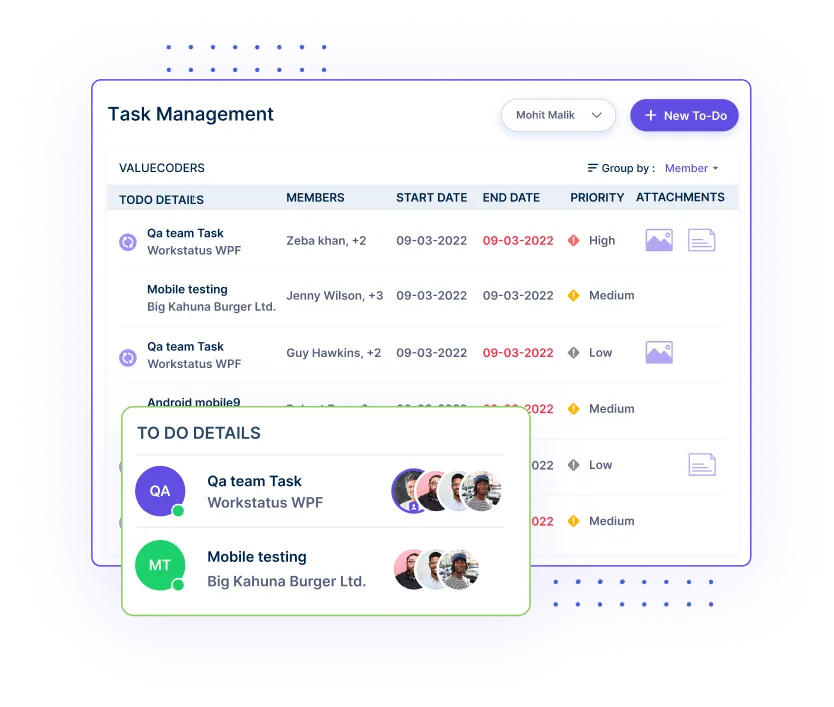
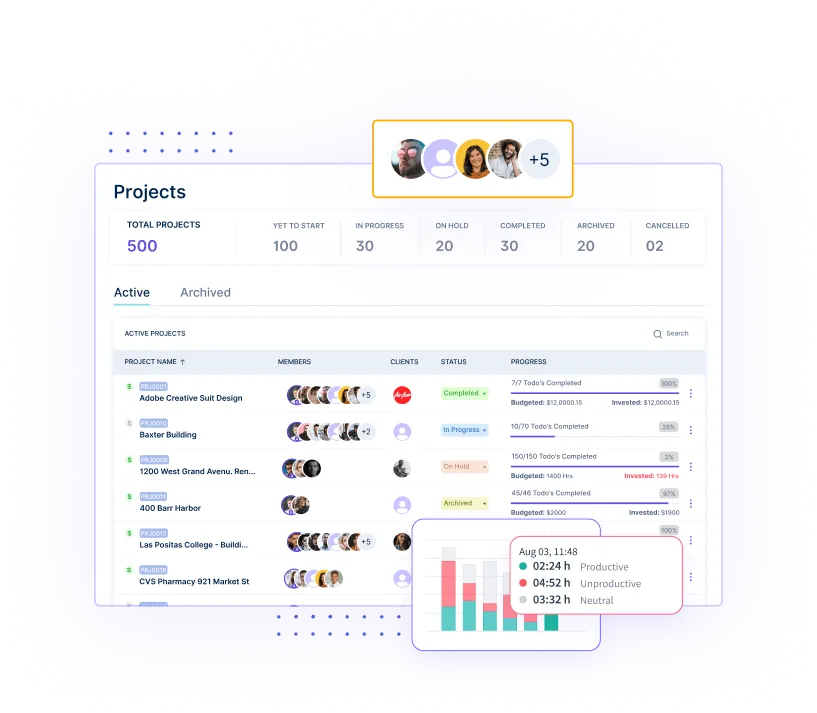

The UI makes it simple to enter tasks, assign teams, specify the deadline, and even specify dependencies.

Use Gantt charts for a detailed visual project timeline, allowing you to track progress, manage deadlines, and adjust schedules as required.

Arranging project tasks in alphabetic order is useful, particularly when planning.

With the help of the Gantt chart view feature, you can effectively navigate through project timelines and make better decisions.
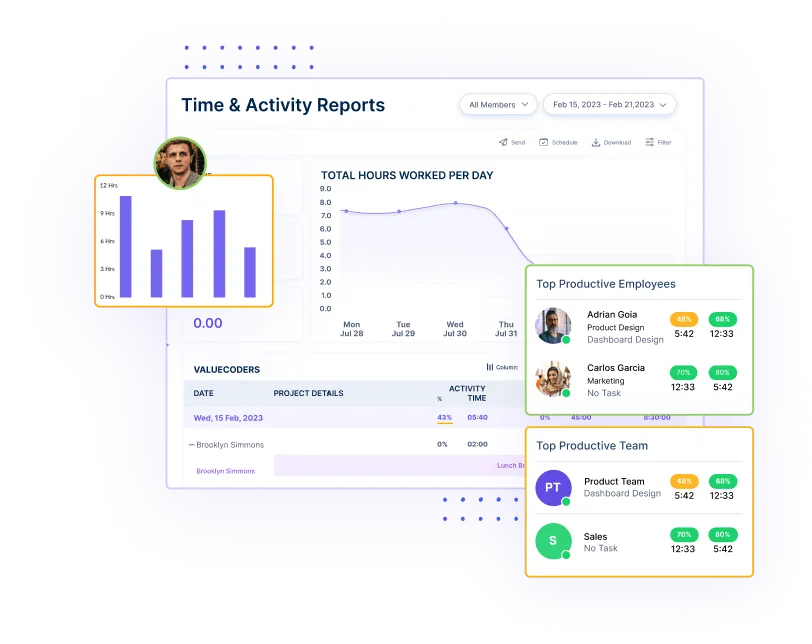
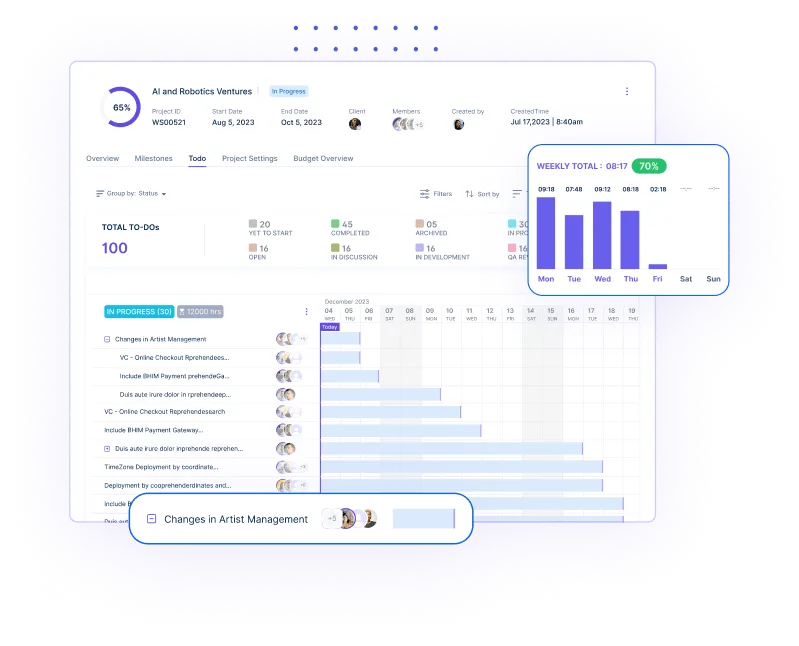
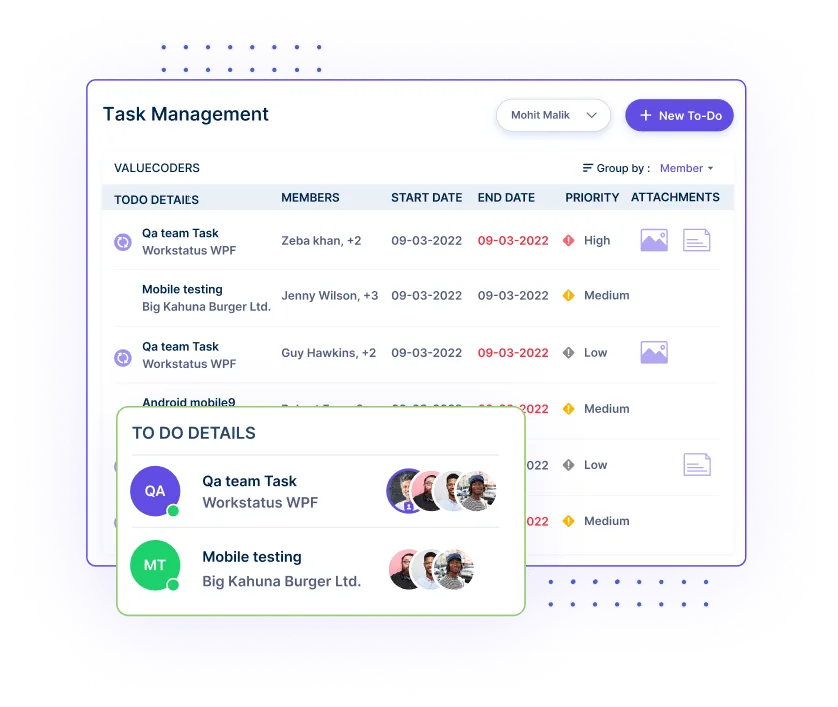
Monitor every project activity to see its progress/milestones and when it will be finished.

For improved planning and supervision, adjust your timetable to the requirements of your project, such as weekly, monthly, or quarterly.

Tailored pre-designed templates to meet project requirements. Modify frameworks and deadlines to visualize tasks and progress, ensuring consistency and saving time.


Gantt charts help you visualize project deadlines and track progress, making project management and workflows easier to understand.


Organize your project’s tasks, dependencies, and due dates in a single, integrated area.
.

Allocate resources efficiently and ensure tasks are assigned based on team availability and project priorities.

Use Gantt charts to accurately predict project timelines and adjust schedules dynamically to accommodate changes, ensuring timely delivery.
Managers utilize Workstatus’s robust features to streamline operations and drive data-informed decisions for enhanced productivity.


To visualize project timelines effectively, download the Gantt chart software on desktops or laptop (Windows, Mac, Linux) according to your preferences.
Simply launch the Workstatus software and create Gantt charts to plan and manage your projects seamlessly. Customize tasks, timelines, and dependencies with ease.
Access real-time project reports and Gantt chart visualizations. Team leaders can analyze project progress and identify bottlenecks to ensure projects stay on track.
Transforming Workforce Productivity and Project Excellence

Login as an employee or manager and start customising your invoices and bills online in your respective dashboards.

Get access to APIs and integrate Workstatus data with any other tool/software your team uses for a single user interface.

Use raw data to generate custom reports with invoices and bills software that gives you more insight into your business performance.
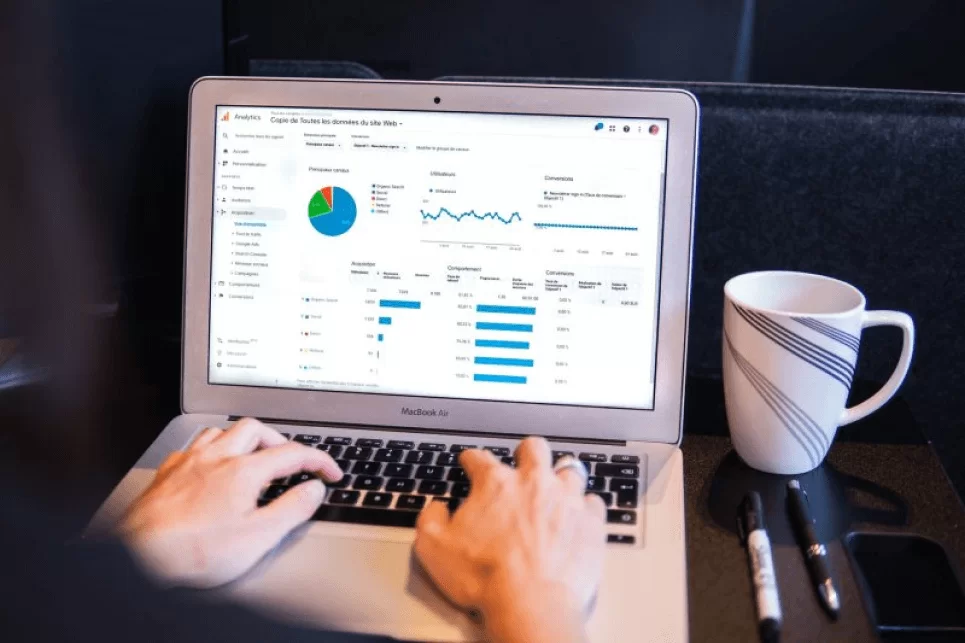
By using Workstatus invoicing software you can save time because everything is in one place from billing, invoicing, work logs, notes on project milestones to organizational goals, and a business owner can use invoice templates and make custom invoices when needed in order to accelerate the growth and efficiency of their business.

You can charge different hourly rates from different clients, allowing you to adjust your prices depending on your client’s flexibility in paying invoices. If they’re quick with payments, you can charge more. If they take their time settling your invoices, you can charge less. It gives both parties a great deal of flexibility that can be beneficial for both sides.
Also, Workstatus allows you to automatically create multiple invoices per job so you can charge multiple times a day as needed. This saves an incredible amount of time and effort so there’s no need to spend precious hours every month issuing new bills and tracking down payment details!

As a business owner, your time is precious. There’s plenty to do and very little time to get it done. This is why you must be making informed decisions with relevant data at hand. From invoicing and billing to payroll tracking and timesheets, there are several ways Workstatus can help you increase efficiency, save money and provide greater insight into operations on a day-to-day basis. Plus, with all these insights you can take better control over finances which means fewer worries and less stress in general.
Our lightweight app allows you and your team to track time, no matter where you are. With GPS tracking and geofencing, anyone can clock in automatically when they enter a job site or get reminders based on location.
Workstatus account required to use apps
A Gantt chart is a visual tool used in project management to represent the timeline of tasks and activities required to complete a project. It displays tasks as horizontal bars along a timescale, allowing project managers to see the start and end dates of each task, their duration, and their relationships with other tasks.
Gantt charts help teams plan, schedule, and track project progress by providing a clear overview of project timelines, dependencies, and milestones.
Gantt charts visually represent project tasks, durations, and dependencies in a timeline format. Each task is displayed as a horizontal bar, with its length representing its duration and position on the timeline, indicating its start and end dates.
Tasks are often color-coded to indicate different categories or priorities, and dependencies between tasks are shown as lines connecting the bars. Project managers can easily identify critical path tasks, monitor progress, and adjust schedules to keep the project on track by viewing the Gantt chart.
While Gantt charts are versatile and widely used in various industries and project types, they may not suit every project.
Projects with simple, straightforward timelines and few dependencies may not benefit as much from Gantt charts as complex, multi-phase projects with many interrelated tasks.
However, Gantt charts can still provide value by offering a structured approach to project planning and management, regardless of project size or complexity.
Several tools are available for creating Gantt charts, from simple spreadsheet templates to dedicated project management software.
Many project management tools offer built-in Gantt chart functionality, allowing users to create, edit, and customize Gantt charts directly within the software.
Alternatively, users can create Gantt charts manually using spreadsheet software like Microsoft Excel or Google Sheets by entering task data and formatting the chart accordingly.
es, Gantt charts are compatible with many project management tools and software platforms, including popular tools like Asana, Trello, and Microsoft Project.
Many project management software platforms offer Gantt chart integrations or built-in Gantt chart features, allowing users to create and update Gantt charts alongside other project management activities.
This integration streamlines project planning and execution by centralizing project data and providing a comprehensive view of project timelines and progress.
Yes, Workstatus allows you to customize the appearance of your Gantt chart to suit your preferences and project needs. You can adjust settings such as color schemes, taskbar styles, date formats, and more to create a Gantt chart that meets your requirements.
Workstatus provides tools for tracking progress on your Gantt chart in real time. You can update task statuses, mark milestones, and adjust timelines directly within the Gantt chart interface. Workstatus also offers reporting and analytics features that allow you to monitor project progress and performance over time.
Yes, Workstatus lets you easily share your Gantt chart with team members, stakeholders, or clients. You can generate shareable links or export the Gantt chart as a PDF or image file to distribute to others. This ensures everyone has access to the most up-to-date project timeline and progress information.
Absolutely. Workstatus offers seamless integrations with various project management tools and software platforms, allowing you to sync your Gantt chart data with other project data and workflows. This integration streamlines project planning and execution by centralizing project information and facilitating collaboration across different tools and teams.
Track time and productivity effortlessly.
Customized Solutions for Maximum Productivity